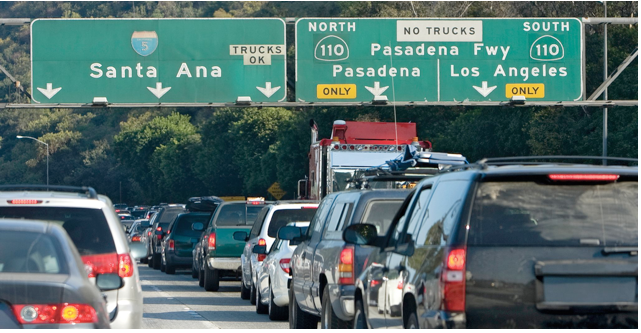
CommentsDOUBTFUL DATA-Inrix is an international company which provides a variety of Internet services and mobile applications pertaining to road traffic and driver services. It publishes Traffic Congestion Scorecards for major cities around the world.
Its latest Scorecard, which Inrix released Wednesday, reports that Los Angeles has the most congested traffic in the nation.
Inrix’s value does not rest in explaining the reasons Los Angeles has the worst traffic. Rather, it provides its data and some general correlation between traffic congestion and other factors such as the strength of the local economy and the unemployment rate.
Inrix is not a policy wonk. Although it is an international company producing “Traffic Scorecards” on a global basis, its methodology shows that the company has no knowledge of specific local factors such land use decisions, structure of government, degree of political corruption, etc.
In order to understand the significance of Inrix’s 2016 Scorecard for the year 2015, one needs to look at its underlying data.
- Los Angeles is not Los Angeles
The area which Inrix calls Los Angeles is not Los Angeles. It uses a hypothetical area identified as “LA-Long Beach-Santa Ana.” While it may be convenient to gather data using this particular constellation of cities, it is not really the City of Los Angeles nor is it the County of Los Angeles. The parameters of “LA” may be hidden away somewhere in the Inrix publications, but this writer could not find them.
Thus, it is not possible to know whether the data takes into account traffic coming to “LA” from Simi Valley and Thousand Oaks. And there’s no way to know whether traffic coming from San Bernardino and Riverside along the 91 Freeway into Santa Ana makes a significant contribution to the “Los Angeles” traffic.
The facts on which we base policy must be relevant. We cannot blindly accept data that lacks statistical validity. Reading the Inrix Scorecard, we see that its statistical underpinnings make it worthless as a basis for any policy decisions.
For example, does Inrix count the traffic into the San Gabriel Valley over Kellogg Hill on the San Bernardino Freeway (Route 10)?
The use of “L.A. Long Beach Santa Ana” for Los Angeles suggests that the study is heavily weighed by the Golden State Freeway (Route 5) between DTLA and Santa Ana.
- Some data seem to be for only the City of Los Angeles while the “LA Long Beach Santa Ana” area is much larger
Some of the non-traffic data such as population growth (7/10 of 1%) and unemployment rate (5.9%) seem be only for the City of Los Angeles. The “LA Long Beach Santa Ana” area probably has about three times the population of the City of Los Angeles. But there is no way for us to know this since Inrix’s use of the term “LA Long Beach Santa Ana” for “Los Angeles” is actually an unknown area with an unknown population and unknown geographic boundaries.
- Garbage in, Garbage Out
Inrix Traffic Congestion Scorecard is so non-specific it’s like announcing the results of Lakers’ and Clippers’ games as, “Los Angeles basketball teams scored 154 points in their games against the Nicks and another team.”
As we analyzed the Inrix data, we anticipated being able to reach some reasonable policy conclusions. But after looking at the factual foundation of Inrix’s Scorecard, we quickly saw that the mixture of geographic areas that have no parameters makes it impossible to reach significant conclusions -- other than what we already know from the morning traffic reports on TV, that is, “the 5 Freeway is very congested in LA and Orange Counties.”
(Richard Lee Abrams is a Los Angeles attorney. He can be reached at: [email protected]. Abrams views are his own and do not necessarily reflect the views of CityWatch.) Edited for CityWatch by Linda Abrams.


